
Phillips curve for beginners
Educational only. This primer introduces the Phillips curve as a debate map linking inflation and unemployment. It is not a trading rule, not a Fed call, and not a promise that the tradeoff is stable.
Site vs Telegram
Curve vocabulary stays here. When officials debate jobs-vs-inflation tradeoffs after a print, use Telegram: Macro Simplified on Telegram.
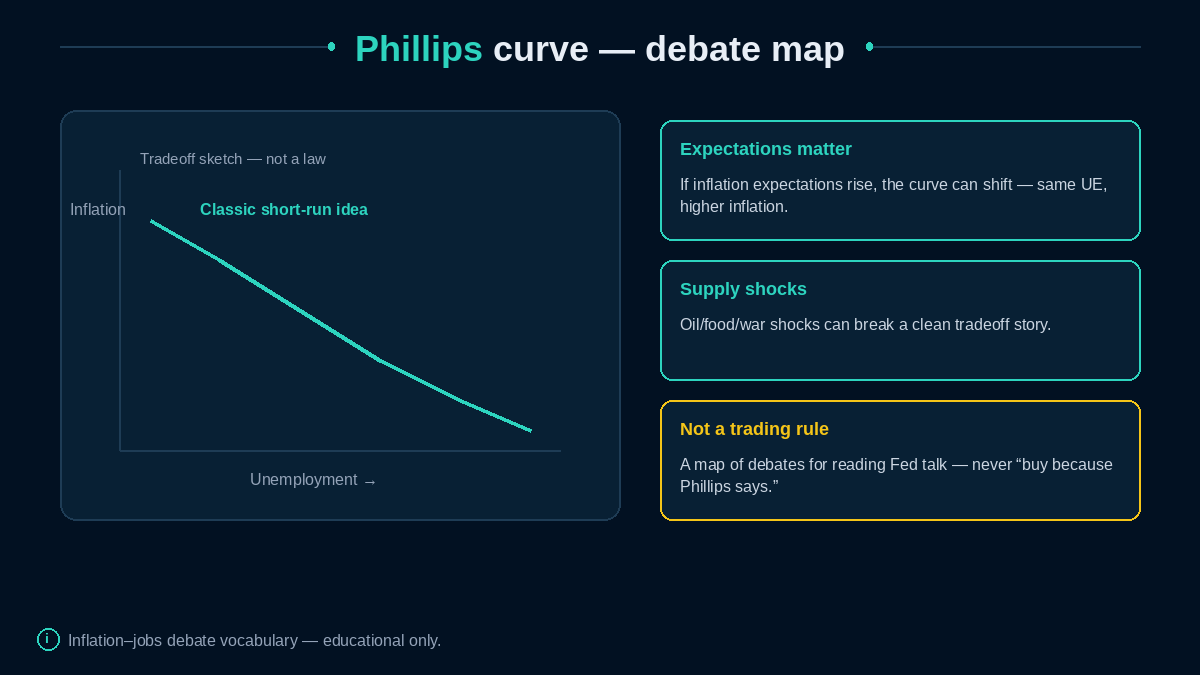
Diagram: Classic short-run sketch plus why expectations and supply shocks complicate it.
The classic short-run sketch
In its simplest teaching form, the Phillips curve suggested a short-run tradeoff: lower unemployment paired with higher inflation, and higher unemployment with lower inflation. Draw unemployment on one axis and inflation on the other, sketch a downward-sloping curve, and you have the textbook cartoon.
That cartoon helped organize mid-20th-century debate. It is not a law of nature and not a button you press to choose an inflation/unemployment pair. Real economies shift; expectations adjust; supply shocks intervene.
Why expectations broke the simple story
If people come to expect higher inflation, wages and prices can adjust so that the same unemployment rate sits beside higher inflation—the curve “shifts.” Anchored expectations (beliefs that inflation will return near goal) are part of modern policy talk. Unanchored expectations are the nightmare version of the same vocabulary.
You will meet expectations again in Real rates and breakevens and in Fed credibility stories inside Reading the Fed. This page only needs the headline: expectations can move the relationship.
Supply shocks and other spoilers
Oil spikes, shipping snarls, and tariff-like cost shocks can lift prices while activity softens—awkward for a clean unemployment-inflation tradeoff. See Demand shocks vs supply shocks and Tariffs as a macro shock.
Composition matters too: goods may cool while services stick (Sticky services and shelter inflation). Labor-market detail beyond the unemployment rate lives in Unemployment types and Jobs and growth.
How to use it as a reader (not a trader)
When a speech says “the labor market is still tight relative to our inflation goal,” you are hearing Phillips-adjacent logic: resource utilization vs price pressure, filtered through the dual mandate and the output gap.
Your job:
- Notice whether the speaker assumes a stable tradeoff or emphasizes shifts/shocks.
- Separate data description from policy preference.
- Refuse any “Phillips says buy/sell” leap—this site never makes that leap.
Common confusions
- “The Phillips curve is dead, so ignore jobs for inflation.” Relationships change; labor still matters in many frameworks.
- “The Phillips curve is gospel, so ignore supply shocks.” Shocks spoil clean tradeoffs.
- “One scatterplot settles the debate.” Sample periods and measures change the picture.
- “I can trade the curve.” No—debate map only.
In practice — two speeches, two emphases
One official stresses how low unemployment risks firming inflation; another stresses supply improvements that can cool prices without job losses. Both can be Phillips-adjacent while disagreeing on slopes and shifts. Your literacy win is hearing which assumption about the curve they are using—stable tradeoff, shifted expectations, or shock-dominated.
That listening skill beats memorizing a 1960s scatterplot.
How this connects
- Dual mandate · Output gap and potential GDP
- Inflation 101 · Inflation regimes
- Unemployment types · Jobs and growth
- The Fed toolkit
Related reads
Telegram
Jobs-and-inflation debate days: Join Macro Simplified.