
Business cycle
Educational only. This primer is a map of how economies expand and slow over time. It does not date recessions, call the next peak or trough, or recommend any investment action based on “where we are in the cycle.”
Site vs Telegram
Use this page to learn cycle vocabulary. For live jobs, inflation, and Fed-day decoding that feeds the cycle debate, join Telegram: Macro Simplified on Telegram.
Economies do not grow in a straight line. Activity speeds up and cools off. Macro people call that pattern the business cycle. Learning the map helps you follow debates about jobs, inflation, and Fed policy without treating every soft print as a certified turning point.
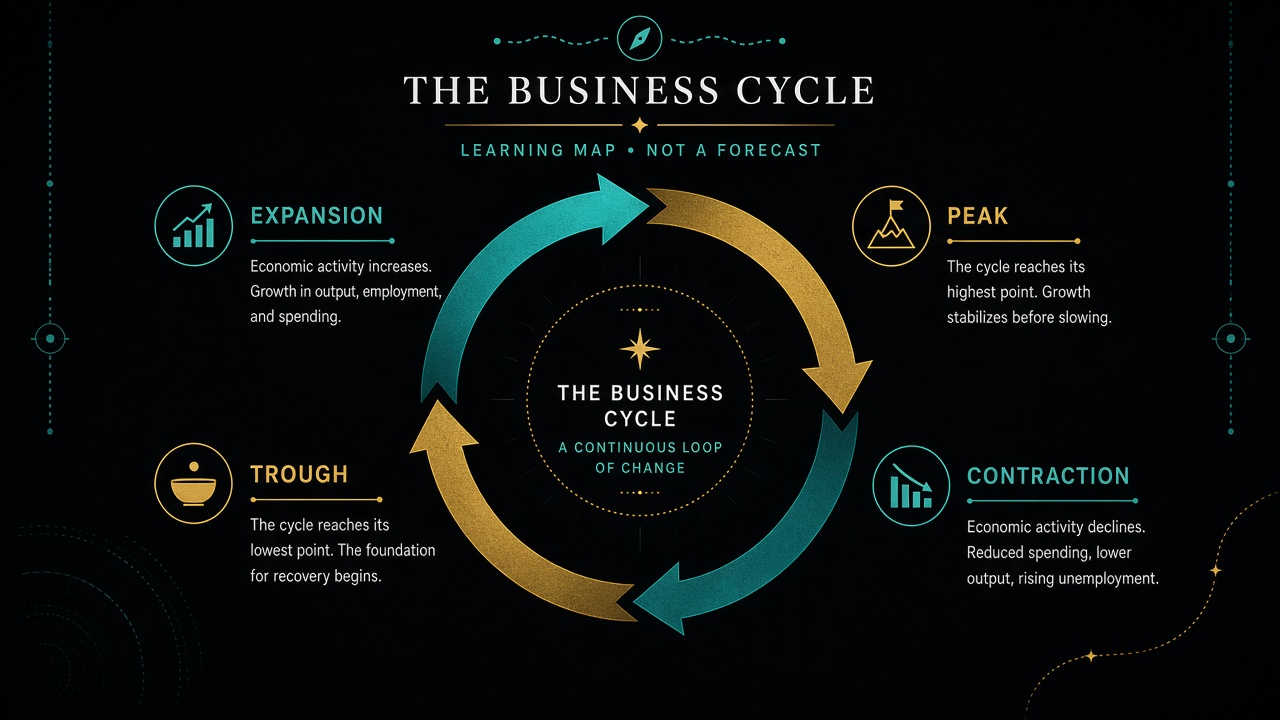
Diagram placeholder: the four-phase cycle as a learning loop — not a timing clock.
The four-phase learning map
Textbooks often split the cycle into four phases. Treat them as labels for orientation, not as a stopwatch you can read precisely in real time.
Expansion
Output, hiring, and spending are generally rising. Businesses invest more; unemployment tends to fall. Inflation can stay quiet early and heat up if demand outruns supply. This is the “growth dial up” part of How to read macro.
Peak
A peak is the high-water mark of activity before a downturn—not a single day you can mark on a calendar while you are living through it. Peaks are often clearer in hindsight when data are revised and historians draw the line.
Contraction
Activity shrinks: hiring slows or reverses, spending softens, and spare capacity rises. A deep or prolonged contraction is what people usually mean by recession in everyday talk—though official dating (in the U.S., a committee looks at a range of indicators) is separate from newspaper headlines.
Trough
The low point before recovery begins. Like peaks, troughs are often labeled after the fact. Expansions that follow can be slow or fast; the map does not dictate the speed.
Why this site teaches the map without dating it: real-time data are noisy, revisions are large, and “we are at the peak” is a forecast dressed as a fact. Macro Simplified keeps cycle language educational.
Leading, coincident, and lagging (simple)
Not every indicator tells you about today the same way. A classic teaching split:
Leading (earlier clues)
Measures that tend to turn before the broad economy does—examples beginners hear include weekly jobless claims shifts, some survey indexes, and parts of the yield curve conversation. “Tend” is doing real work: leading indicators can false-alarm.
Coincident (with the economy)
Measures that move roughly with current activity—payroll employment and industrial production often sit in this bucket in textbook lists. They describe the present pulse more than they predict the next turn.
Lagging (confirm after)
Measures that usually turn after the cycle has already shifted—unemployment can keep rising after a trough, and some wage or inflation measures settle late. They confirm; they rarely lead.
You already met a lighter version of this idea in How to read macro. The habit is the same: ask whether a number is hinting at a turn or confirming the recent past. For jobs detail, see Jobs and growth. For prices, see Inflation 101.
Soft landing and hard landing as vocabulary
Two phrases dominate modern cycle talk:
- Soft landing: inflation cools toward the central bank’s comfort zone while growth slows only modestly and the labor market softens without a deep downturn.
- Hard landing: demand cools enough that growth and jobs take a sharper hit—often the scenario people contrast with a soft landing when policy is tight.
These are scenario labels for organizing debate—exactly as Jobs and growth frames them. They are not forecasts this site makes, not probability scores we publish, and not dated recession calls.
When you hear “soft landing is still intact,” translate it to: “commentators think the expansion is cooling gently.” When you hear “hard landing risks are rising,” translate it to: “commentators think contraction risk is higher.” Then check the data yourself with a calm process—not a panic trade.
How the cycle links to Fed, inflation, and jobs
The Fed’s dual mandate sits inside the cycle story:
- Hot expansions can push inflation higher → debate leans toward tighter policy (The Fed toolkit).
- Contractions can lift unemployment → debate leans toward easier policy, if inflation allows.
- The awkward middle—sticky inflation with softening jobs—is why FOMC days feel consequential.
None of that chain is a signal to buy or sell. It is the reason macro readers watch payrolls, CPI/PCE, and Fed communication together. On release days, keep the Event playbook open and use Telegram for the live decode.
Fiscal choices (spending and taxes) also shape demand across the cycle; for a neutral primer, see Fiscal policy basics.
Anti-forecast reminders
- Do not treat one weak NFP or one hot CPI as “the peak” or “the trough.”
- Do not invert the yield curve into a calendar date for recession on this site’s authority—we do not provide that.
- Do not use soft/hard landing labels as portfolio instructions.
The cycle map helps you read arguments. Live prints update those arguments; durable definitions stay here.
Related reads
- Jobs and growth
- How to read macro
- Inflation 101
- The Fed toolkit
- Fiscal policy basics
- Event playbook
- Glossary
Telegram
Cycle-relevant jobs, inflation, and FOMC decoding: Join Macro Simplified.