
China and global spillovers
Educational only. This primer maps spillover channels from China’s economy to the rest of the world. It is not a collapse prediction, not a decoupling prophecy, not a China equity tip, and not geopolitical campaigning.
Site vs Telegram
Channel maps live here. When China data move global headlines, Telegram carries calm context: Macro Simplified on Telegram.
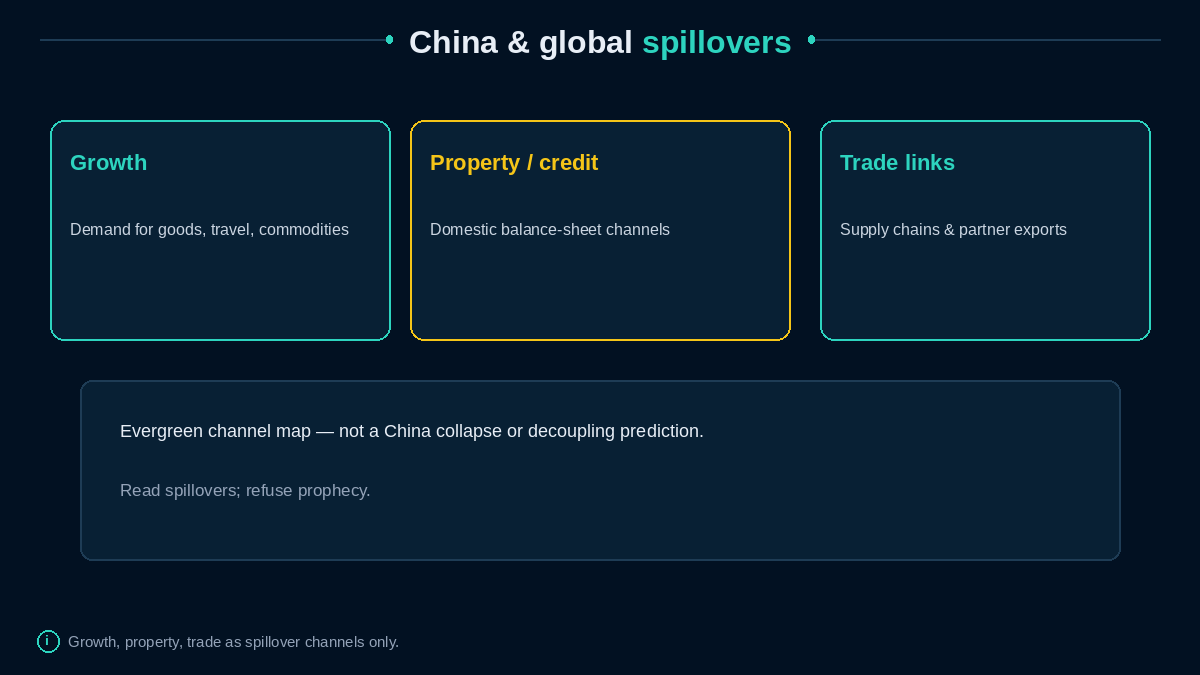
Diagram: Growth, property/credit, trade — evergreen channels, no collapse call.
Why spillovers exist
China is a large share of global manufacturing, commodity demand, and trade networks. When Chinese growth, credit, or property conditions shift, partner exports, metals prices, and supply-chain timelines can move (Trade and the balance of payments, Commodities and the dollar).
Treat those as channels, not as a single “China risk” switch.
Three teaching channels
- Growth / demand — imports of goods, tourism, and commodity appetite.
- Property and credit — domestic balance-sheet adjustments that can alter investment and confidence.
- Trade and supply chains — partners feel both demand soft patches and supply disruptions.
Policy tools (PBOC and fiscal) belong in Global central banks at a glance and Fiscal policy basics without this page forecasting them.
Hard refusal list
- No “China collapse” dating
- No “inevitable decoupling” manifesto
- No bullish/bearish equity targets
- No partisan foreign-policy stump speech
If a sentence needs a prophecy to work, delete it.
Common confusions
- “One property headline equals global recession.” Spillovers vary by partner exposure.
- “Commodity prices are only about China.” Dollar, supply shocks, and geopolitics also matter (Energy shocks and inflation).
- “Spillovers only run one way.” Global demand and tech controls feed back too.
- “Channel literacy is a trade.” Not here.
In practice
Rewrite hot takes into: Which channel? Which partners? What is measured vs speculated? Pair with Geopolitics and risk premiums when sanctions or tech controls dominate, and with Emerging markets and the dollar when USD funding is the real stressor.
Data opacity and revision patterns deserve the same humility you bring to any national statistics (Data revisions and nowcasting, Sources and habits). Private activity gauges and official prints can diverge in noisy periods—another reason to prefer channel language over single-number certainty.
Technology, capital-flow management, and geopolitics can alter spillover coefficients over time (Geopolitics and risk premiums, Capital flows for beginners). That evolution is why evergreen maps beat dated “China will X by year Y” essays.
For partners, ask exposure type: commodity exports, tourism, intermediate-goods supply chains, or financial claims. Exposure type predicts which Chinese headline matters—without licensing a blanket risk-on/off switch.
Property channels can affect local government financing vehicles and bank asset quality in domestic debates—macro readers abroad mainly need the spillover footprint (steel, copper, partner exports), not a full domestic institutional deep dive on this single page.
Watch for in headlines: China activity prints paired with copper, shipping, or partner-export stories. Name the channel (growth, credit/property, trade) explicitly; skip collapse prophecy.
Tourism and education services exports of partners can move with Chinese household confidence—another soft channel beside hard commodity tons. Soft channels still count in spillover maps.
How this connects
- Trade and the balance of payments · Commodities and the dollar
- Capital flows for beginners · Global central banks at a glance
- Demand shocks vs supply shocks
Related reads
- Trade and the balance of payments
- Commodities and the dollar
- Global central banks at a glance
- Geopolitics and risk premiums
- Glossary
Telegram
China-data spillover days: Join Macro Simplified.