
Labor force participation
Educational only. This primer explains labor-force participation as measurement vocabulary. It is not a jobs forecast, not a policy campaign, and not advice about anyone’s career choices.
Site vs Telegram
Labor measurement lives here. When participation shows up in an employment report, Telegram carries the live gloss: Macro Simplified on Telegram.
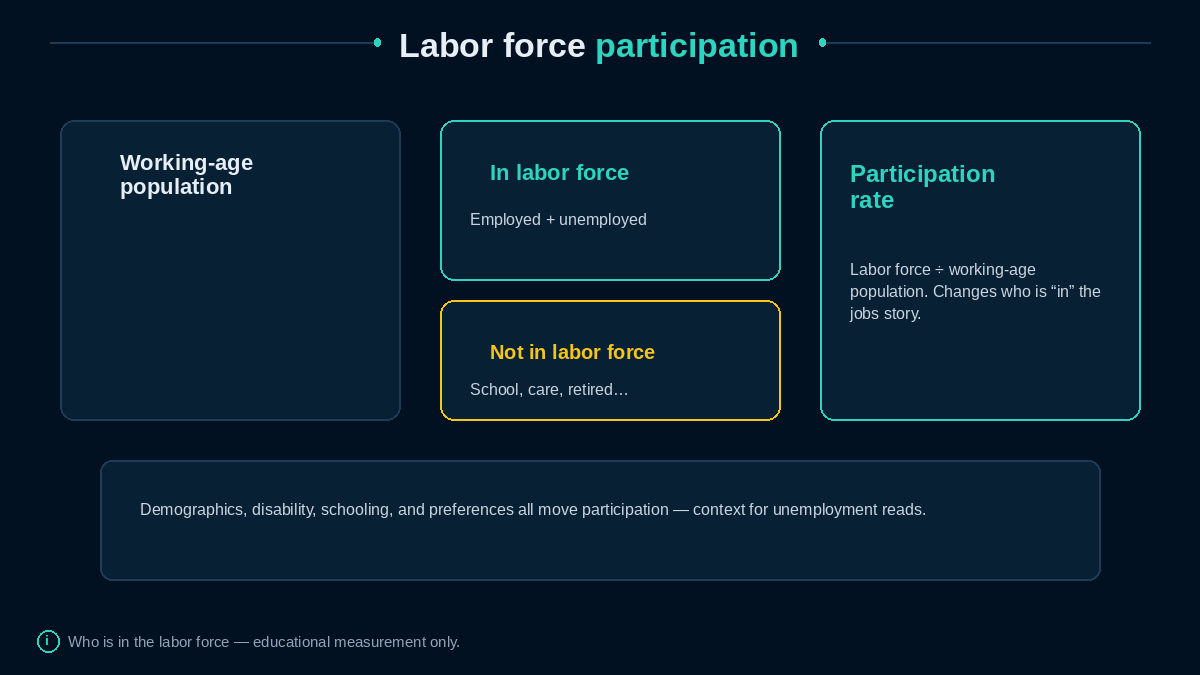
Diagram: Participation rate = labor force ÷ working-age population — who is “in” the jobs story.
Who is “in” the labor force?
The labor force = employed + unemployed (people without a job who are available and actively looking, in the usual survey definitions). People who are retired, in school, caregiving full-time, or otherwise not seeking work are not in the labor force.
The participation rate is roughly:
Labor force ÷ working-age population
When participation rises, more people are counted as available for work. When it falls, the unemployment rate can improve partly because people left the labor force—not only because hiring boomed. That is why participation is a companion read beside Unemployment types and Jobs and growth.
Why participation moves
Common teaching drivers:
- Demographics — aging populations often pull aggregate participation down
- Schooling and career timing — younger cohorts in education
- Health and disability
- Caregiving and household choices
- Cyclical discouragement or encouragement — soft markets can push people out; hot markets can pull them in
None of these is a moral scoreboard. They are reasons the same unemployment rate can hide different labor-supply stories. Immigration and labor supply is a neighboring channel (Immigration and labor supply).
How it changes the jobs story
A falling unemployment rate with falling participation is a different narrative than falling unemployment with rising participation. Payrolls (establishment survey) and household survey concepts can diverge in noisy months—another reason to use a dashboard, not a single hero number (Leading vs lagging indicators, Data revisions and nowcasting).
For capacity and output gap talk, labor supply is an ingredient of potential output (Growth and productivity).
Common confusions
- “Unemployment rate tells the whole labor story.” Participation and prime-age rates add context.
- “Not in the labor force means lazy.” Many exits are demographic, educational, or caregiving.
- “Participation is a Fed policy tool.” The Fed watches labor; it does not set the participation rate like the funds target.
- “This page forecasts NFP.” It does not.
In practice — a participation sentence to practice
“Unemployment fell, but participation also fell, so some of the improvement is people leaving the labor force.” Being able to say that calmly is the literacy win—then open the Event playbook on NFP day.
Prime-age participation (roughly ages 25–54 in many U.S. charts) is a popular companion metric because it strips out some retirement and schooling effects. If prime-age participation is firm while the overall rate is soft, demographics may dominate the aggregate. If both slump in a downturn, cyclical discouragement may be in play. Use both lenses beside Immigration and labor supply without turning either into a political slogan.
How this connects
- Unemployment types · Jobs and growth
- Immigration and labor supply · Output gap and potential GDP
- Dual mandate · Sources and habits
Related reads
- Jobs and growth
- Unemployment types
- Immigration and labor supply
- Output gap and potential GDP
- Glossary
Telegram
Employment-report participation footnotes: Join Macro Simplified.