
Long-term debt cycles
Educational only. This primer introduces long-term debt-cycle concepts popularized in teaching templates (including Dalio-style sketches). It is not a market call, not a crash date, and not a product pitch for any author’s funds or books.
Site vs Telegram
Concept templates live here. Live debt and credit headlines: Macro Simplified on Telegram.
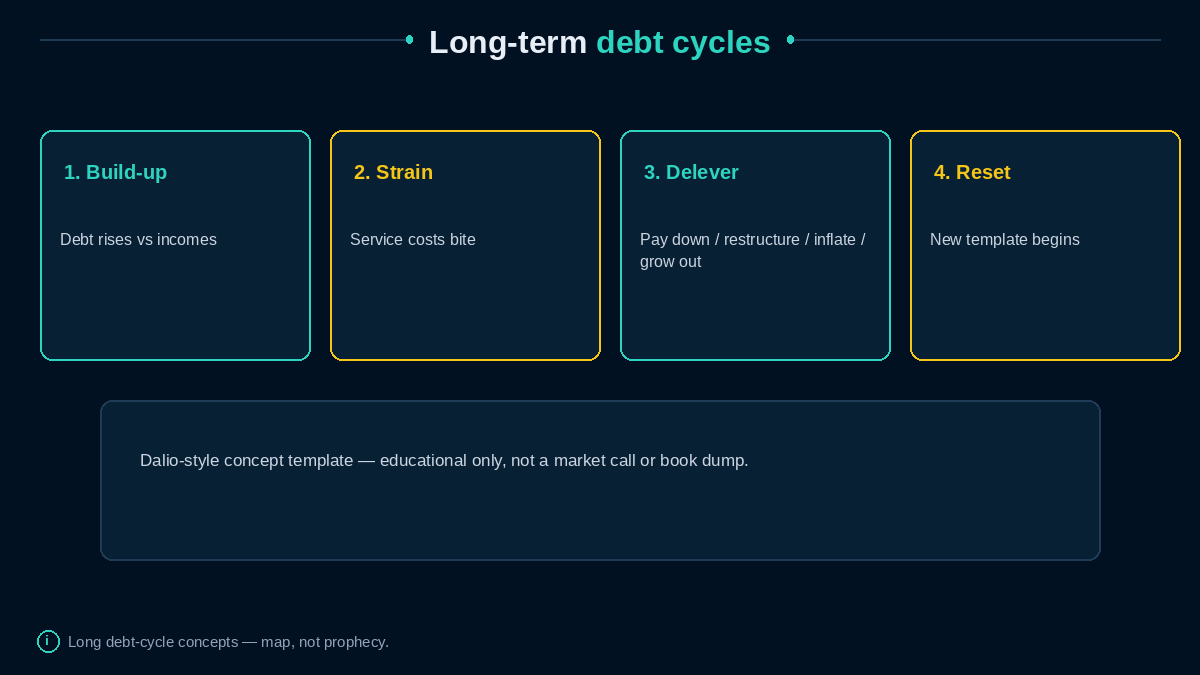
Diagram: Build-up → strain → delever → reset — educational template, not prophecy.
Short vs long maps
Credit cycles often describe shorter swings in lending standards and leverage. Long-term debt-cycle talk zooms out: decades of debt rising relative to incomes, then a period where service costs and refinancing strain force a broader reset.
Keep it as a template for organizing history, not a crystal ball for next quarter (Debt and leverage, Deficits, debt, and debt-to-GDP).
Teaching stages (simplified)
- Build-up — credit expands; asset prices and debt rise together.
- Strain — rates, growth, or confidence make service harder.
- Deleveraging levers (textbook menu): austerity/paydown, restructuring/defaults, wealth transfers, money printing/inflation, or growing out via productivity—often mixed.
- Reset — balance sheets and norms stabilize into a new phase.
Real history is messier than four boxes. The value is recognizing lever language when commentators argue.
What this page will not do
- Date the “end of the cycle”
- Endorse one author’s investment franchise
- Equate every deficit year with a once-in-a-century climax
- Tell you to buy gold, bitcoin, or cash because “the template says so”
Common confusions
- “Template = timed prophecy.” Templates organize; they do not timestamp.
- “Only governments matter.” Private debt cycles are central too.
- “Inflation always clears debt painlessly.” Inflation is one contested lever with winners and losers.
- “Short credit cycle and long cycle are identical.” Different zoom levels.
In practice
When you hear “debt supercycle,” ask which lever the speaker favors and what evidence they cite—then compare with shorter business cycle indicators. Stay with Fiscal dominance vocabulary for monetary–fiscal tension language without merging all phrases into one doom brand.
Productivity growth and demographics change how heavy a debt stock feels relative to incomes—another bridge to Growth and productivity and Output gap and potential GDP. A rising debt-to-GDP ratio in a high-growth economy is a different story than the same rise with stagnation.
Private and public debt can swap places across the long cycle: household deleveraging alongside public deficit expansion is a familiar historical pattern in some crises (Automatic stabilizers, Deficits, debt, and debt-to-GDP). Templates that ignore the swap miss half the accounting.
Refuse guru timelines. If a chart labels “you are here” on a multi-decade clock, treat it as storytelling unless backed by transparent method—and even then, not as a trade ticket.
Compare notes with short-cycle credit maps rather than replacing them. You can watch lending standards this year while still knowing multi-decade debt templates exist—different telescopes, same sky.
Watch for in headlines: “supercycle” charts, deleveraging-lever lists, and debt-to-income extremes. Treat them as templates for debate—verify methods, refuse dated prophecies.
Interest-rate regimes change debt service arithmetic: low-rate decades can mask loads that look heavier when rates normalize. That arithmetic link bridges long-cycle talk to ordinary rate literacy.
How this connects
- Debt and leverage · Credit cycles
- Deficits, debt, and debt-to-GDP · Financial crises vocabulary
- Liquidity vs solvency · Bubbles and feedback loops
Related reads
- Debt and leverage
- Credit cycles
- Deficits, debt, and debt-to-gdp
- Financial crises vocabulary
- Glossary
Telegram
Debt-and-credit debate headlines: Join Macro Simplified.